Are your ad campaigns not performing as planned?

What to Check When Your Ad Is Not Performing
When an ad stops performing, the metric that looks wrong is often a step after the metric that changed. A high CPA can start with a slow landing page. A low ROAS can start with a new discount.
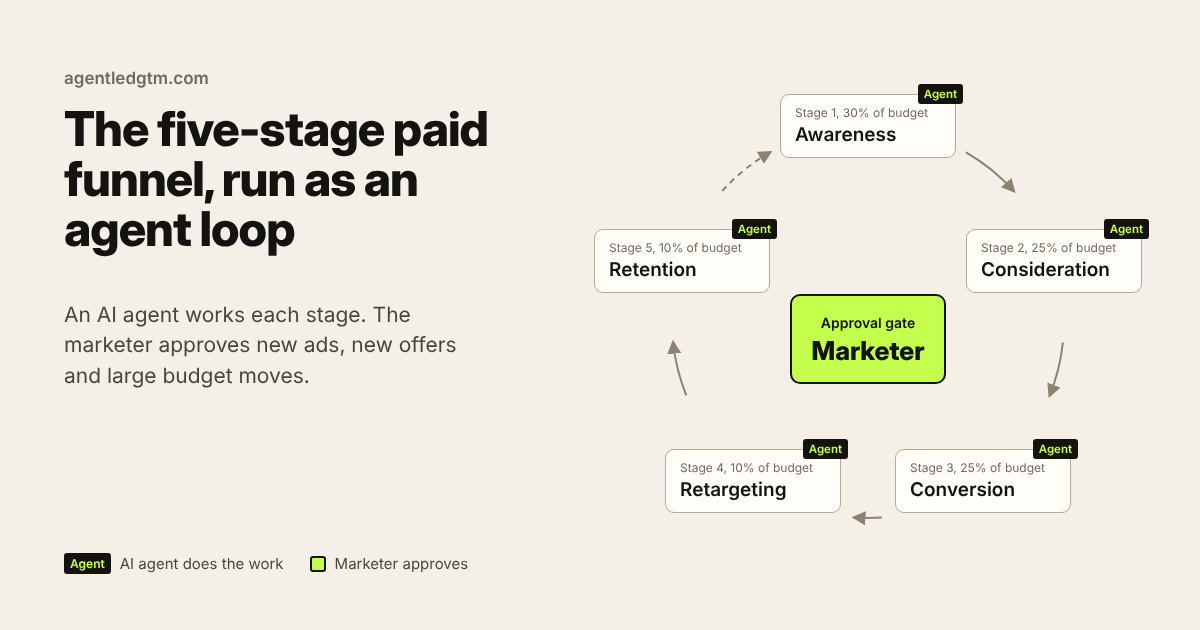
The previous post, How AI Agents Can Run the Five-Stage Performance Marketing Funnel, showed an agent loop with five steps: observe, compare, decide, act and report. In the compare step, an analyst agent finds the stage that misses its target. Then a person or an agent must find the cause.
This post covers that step. It lists ten symptoms. For each symptom, it shows what the symptom often means, what to check and the first data to pull. It also shows the check that an AI agent can run and the decision that stays with the marketer.
Three rules before you change a campaign
A broken conversion event makes a good campaign look like a failed one. Many ad problems are data problems. Use these three rules before you change an ad, an audience or a budget.
- Check the data first. Confirm that each conversion event fires. Then compare the conversions in the ad platform with the orders in your store or the leads in your customer relationship management (CRM) system.
- Read the metrics as a chain. CPA depends on CPC and the conversion rate. CPC depends on CPM and CTR. Find the first metric in the chain that changed, and start there.
- Wait for enough data. Small numbers change a lot by chance. Meta’s guidance says that an ad set needs about 50 optimization events in 7 days to leave the learning phase. A significant edit, such as a new ad or a large budget change, starts the learning phase again. Compare a full week with the four weeks before it.
Terms in this post:
- CPM: the cost per 1,000 impressions.
- CTR: the click-through rate. CPC: the cost per click.
- Conversion rate (CVR): the share of clicks that become a purchase or a lead.
- CPA: the cost per acquisition. CPL: the cost per lead.
- ROAS: the return on ad spend. AOV: the average order value.
- Frequency: the average number of times one person sees the ad.
Ten symptoms and what to check
Each symptom points to one part of the journey from the ad auction to revenue. Select a symptom to see which part to check first.
The symptom finder
Select a symptom. The strip shows where in the journey to look. The panel shows what to check and who does the check.
01. High CPM
You pay more for each 1,000 impressions. The cause is usually in the auction: who you target, who else bids, and where the ad shows.
- Audience size. A very narrow audience limits delivery. You then compete with other advertisers for a small group of people.
- Competition. More advertisers bid for the same people. Look for new competitor campaigns in the Meta Ad Library or in the Google Ads auction insights report.
- Placements. CPM is different for each placement, such as Feed, Stories or Reels. Check the CPM and the results for each placement in the breakdown report.
- Seasonality. CPM often rises in November and December, when more advertisers bid. Compare the CPM with the same weeks last year.
- Ad quality. Meta’s auction includes ad quality. A low-quality ad must pay more to win the same impressions. Check the quality ranking.
02. Low CTR
People see the ad, but they do not click. The cause is usually in the ad itself. Sometimes a good ad goes to the wrong people.
- Hook. Check the first line of text and the first 3 seconds of video. For video, divide 3-second views by impressions. A low result means that people scroll past.
- Creative. Check the format and the image. An ad that looks like every other ad in the feed gets fewer clicks.
- Messaging. Check that the ad names the problem in the words that customers use. Reviews and sales calls give you those words.
- Offer. Check that the ad gives a clear reason to click now, such as a price, a trial or a free resource.
- Audience match. On Meta, a below-average engagement rate ranking can show that the ad does not match the audience.
- Stage. Compare CTR with the target for its funnel stage. Awareness ads usually get a lower CTR than retargeting ads.
03. High CPC
Each click costs too much. CPC equals CPM divided by (1,000 × CTR). So a high CPC comes from a high CPM, a low CTR, or both. Find which one changed.
- CTR. If CTR fell, CPC rises at the same CPM. Go to symptom 02.
- Audience relevance. An ad that goes to people who do not need the product gets few clicks, so each click costs more.
- Keyword intent. On search, broad keywords match searches with weak intent. Read the search terms report and add negative keywords.
- Quality Score. On Google Ads, check expected CTR, ad relevance and landing page experience for each keyword.
- Competition. More bidders on the same keywords raise the price. The auction insights report shows who competes with you.
04. Good CTR, low conversion rate
The ad does its job, because people click. The problem starts after the click: on the landing page, in the offer or in the form.
- Message match. The landing page must repeat the promise of the ad: the same offer, the same words and a similar image.
- Page speed and mobile. Compare clicks with landing page views. A large difference often shows a slow or broken page. Test the page on a phone.
- Offer. Check the price, the terms and the guarantee. The offer on the page must match the offer in the ad.
- Trust signals. Add reviews, real testimonials, clear contact details and a clear return policy.
- Conversion experience. Count the form fields and the steps. Check the button text and look for errors.
- Tracking. A broken conversion event looks like a low conversion rate. Confirm that the event fires.
On Meta, an average or better quality ranking and engagement rate ranking with a below-average conversion rate ranking points to the experience after the click.
05. High CPA
CPA equals CPC divided by the conversion rate. So each step of the journey changes CPA. Do not change one metric before you know which step changed. Trace the full journey:
- Ad. Check CPM and CTR, which together set CPC. Compare both with their targets.
- Click. Compare clicks with landing page views.
- Landing page. Check the share of visitors who add to cart or start the form.
- Conversion. Check the share of carts or forms that finish.
- Tracking. Compare the conversions in the platform with the orders in the store or the leads in the CRM.
Find the step with the largest change from the previous four weeks. Fix that step first. Also check the learning phase: a new ad set or a large edit makes CPA less stable for a period.
06. Low ROAS
ROAS equals revenue divided by ad spend. It also equals AOV divided by CPA. So a low ROAS has two sources: each conversion costs too much, or each conversion earns too little.
- CPA. If CPA went up, go to symptom 05.
- AOV. Check discounts, bundles and the product mix. A new discount can lower AOV while the number of orders stays the same.
- Conversion rate. A lower conversion rate raises CPA, which lowers ROAS.
- Margins. Break-even ROAS equals 1 divided by the gross margin. At a 40% margin, you need a ROAS of 2.5 to break even. At a 25% margin, a ROAS of 3 loses money.
- Revenue attribution. Compare the revenue in the platform with the revenue in the store or CRM. Check the attribution window. A long sales cycle can move revenue outside the window.
- Blended ROAS. Divide total revenue by total ad spend for all channels. Compare it with the ROAS that each platform reports.
07. High frequency, falling results
The same people see the ad too often. CTR falls and CPA rises. Two causes give the same symptom, and each cause needs a different fix.
- Creative fatigue. The audience is large enough, but the ad is old. CTR falls for one ad, while newer ads in the same ad set still perform.
- Audience saturation. The audience is too small for the budget. Frequency rises for all ads. Reach stops growing while spend stays the same.
- Compare the frequency trend with the CTR trend over two to four weeks.
- Check the age of each ad and the size of the audience compared with the budget.
- Watch retargeting audiences closely. They are small, so they saturate faster.
For fatigue, add new creative with a new angle or hook. A new color on the same ad is not enough. For saturation, widen the audience, lower the budget or set a frequency cap.
08. Many add-to-carts, few purchases
People want the product. Something in the checkout stops them. Baymard Institute puts the average documented cart abandonment rate at 70.22%, across 50 studies.
- Unexpected costs. Baymard surveyed US online shoppers who left a cart for a reason other than “just browsing”. Of these shoppers, 40% said that extra costs were too high. Show shipping, tax and fees early, on the product page or in the cart.
- Checkout friction. In the same survey, 18% left because the site wanted them to create an account, and 17% because the checkout was too long. Offer a guest checkout and remove fields you do not need.
- Payment options. In the same survey, 9% left because there were not enough payment methods. Add digital wallets, such as Apple Pay, Google Pay or PayPal.
- Trust. In the same survey, 19% did not trust the site with their card details. Show security, the return policy and reviews near the checkout.
- Mobile. Complete a purchase on a phone yourself.
- Tracking. Confirm that the purchase event fires once, on the order confirmation page.
09. Many leads, poor lead quality
The ad attracts people who fill in the form but do not buy. The platform optimizes for the event that you give it. If that event is “lead”, the platform finds people who fill in forms.
- Targeting. Compare the leads with your ideal customer profile (ICP): role, company size, location and need.
- Messaging. State who the product is for, and give a price range when you can. Clear words make poor-fit people stop before the form.
- Qualification questions. Add one to three questions to the form, such as budget, timeline or role. On Meta lead ads, the Higher intent form type adds a review step before people submit.
- The offer. A free gift or a very easy offer attracts people with low intent. Test an offer that asks for more commitment.
- Feedback. Send qualified-lead or sale events from the CRM back to the ad platform. Use the Meta Conversions API or Google enhanced conversions for leads. The platform then optimizes for quality.
10. Sudden drop in performance
A sudden change usually has a single cause on a specific date. Check the simple causes, in this order, before you rebuild the campaign:
- Tracking. Confirm that the pixel or tag still fires. A site update or a new consent banner can remove or block it.
- Recent edits. Read the change history in Google Ads and the activity history in Meta Ads Manager. On Meta, a significant edit starts the learning phase again.
- Budget changes. Look for a large increase or decrease, a budget that ran out, or an account spending limit.
- Account issues. Check for a failed payment, rejected ads or a policy restriction.
- Platform issues. Check the Google Ads Status Dashboard and the Meta Status page for outages.
- Site issues. Check that the site loads, the landing page works and the product is in stock.
How the metrics connect
A change of half a point in CTR can move a campaign from a loss to a profit. The reason is that each metric feeds the next one:
- CPC = CPM ÷ (1,000 × CTR)
- CPA = CPC ÷ conversion rate
- ROAS = AOV ÷ CPA
- Break-even ROAS = 1 ÷ gross margin
- Maximum CPA = AOV × gross margin
Use the calculator to see how one change moves every metric after it.
The metric chain calculator
Move a slider. The tiles show the new CPC, CPA and ROAS, and the profit or loss for each order before other costs.
The calculator needs JavaScript. The numbers below show the worked example.
Share of clicks that become a purchase
Revenue minus the cost of goods, as a share of revenue
- CPC$1.20CPM ÷ (1,000 × CTR)
- CPA$48.00CPC ÷ conversion rate
- ROAS1.88AOV ÷ CPA
- Break-even ROAS2.501 ÷ gross margin
Each order loses $12.00 after ad cost. To break even, CPA must be $36.00 or less.
In the example, each order loses $12. Now raise CTR from 1.0% to 1.5% and keep everything else the same. CPC falls to $0.80, CPA falls to $32 and ROAS rises to 2.81. Each order now earns $4 after ad cost.
The same rule works in the other direction. If ROAS falls, look at the metrics before it in the chain. Find the first one that changed.
What the platform diagnostics tell you
Meta and Google already grade each ad against its competitors. Both grades are diagnostics. Neither grade is an input to the auction, but each one points to the part of the journey to check.
Meta ad relevance diagnostics
Meta shows three rankings for each ad with more than 500 impressions. Each ranking compares the ad with other ads that compete for the same audience.
| Ranking | What it compares | A low ranking points to |
|---|---|---|
| Quality ranking | The perceived quality of the ad | The creative and the ad itself (symptoms 01 and 02) |
| Engagement rate ranking | The expected engagement rate | The hook, the message or the audience match (symptom 02) |
| Conversion rate ranking | The expected conversion rate, against ads with the same optimization goal | The landing page, the offer or the form (symptom 04) |
Google Ads Quality Score
Google gives each search keyword a Quality Score from 1 to 10. The score has three parts: expected CTR, ad relevance and landing page experience. Each part shows Above average, Average or Below average. A below-average part tells you where to look: the ad copy, the match between keyword and ad, or the landing page.
Where AI agents fit
Most of these checks start with the same task: compare this week with a baseline. An analyst agent can do that task every day, before a person opens a dashboard.
In the agent loop from the previous post, the diagnosis sits between the compare step and the decide step. When a stage misses its target, the agent runs the checks in a fixed order:
- Check tracking. Confirm that each conversion event fires and that platform counts match the store or the CRM.
- Read the change log. Match the date of the change in results with recent edits and budget changes.
- Trace the metric chain. Find the first metric that changed: CPM, CTR, landing page views, conversion rate, AOV or margin.
- Read the platform diagnostics. Add the Meta rankings or the Google Quality Score parts.
- Write a diagnosis note with the evidence and one recommended next step.
A diagnosis note can look like this:
{
  "symptom": "high_cpa",
  "stage": "conversion",
  "period": "last 7 days vs previous 28 days",
  "tracking_ok": true,
  "recent_ad_changes": "none in 14 days",
  "chain": {
    "cpm": "+3%",
    "ctr": "-2%",
    "landing_page_views_per_click": "-31% on mobile",
    "conversion_rate_on_page": "+1%"
  },
  "likely_cause": "Slow mobile landing page after the October 2 site release",
  "next_step": "Marketer approves a fix to mobile page speed"
}
The agents can run the checks. The marketer keeps the decisions that change the business:
| Area | What the agents check | What the marketer decides |
|---|---|---|
| Tracking and changes | The analyst agent checks each conversion event every day and matches drops with the change log. | Approves a rollback |
| Metric chain | The analyst agent splits CPA and ROAS into steps and names the step with the largest change. | Selects the step to fix |
| Creative | The research agent collects customer words. The creative agent drafts new hooks for low-CTR or fatigued ads. | Approves each new ad |
| Audience and budget | The media agent tracks frequency, reach and CPM by placement. | Approves budget changes past the limits |
| Lead quality | The lifecycle agent sends CRM lead status back to the ad platforms. The research agent reads sales notes. | Defines a qualified lead with sales |
| Landing page, checkout and offer | The analyst agent reports clicks compared with page views, and the cart-to-purchase rate by device. | Decides on the offer, price, shipping and page changes |
An agent must not rebuild a campaign to fix a symptom. It reports the cause and the evidence. The marketer approves the fix at the approval gate.
Plan and run your own loop
Start with the funnel and the targets for each stage. Then decide which checks go to agents.
The agent-led funnel
Read how AI agents run the five-stage performance marketing funnel, and where the marketer approves.
Read the first postLoop Campaign Builder
Plan your own loop campaign stage by stage. Download the plan when you finish.
Open the builderGTM Agent Kit
Eleven GTM agents draft the brief, the research, the messaging, the plan, the ad copy and the launch checklist. They stop for your approval at each gate. They never launch a campaign or change an ad budget.
$39 Free for the first 50 founding marketers.
Common questions
What should I check first when an ad is not performing?
Check the data first. Confirm that each conversion event fires, and compare platform conversions with your store or CRM. Then find the first metric in the chain that changed: CPM, CTR, conversion rate, AOV or margin.
Why is my CPM high?
A high CPM usually comes from the auction. Check the audience size, the competition for the same audience, the placements, the season and the quality ranking of the ad.
Why is my CTR low?
A low CTR usually comes from the ad. Check the hook, the creative, the message and the offer. Also check that the ad goes to the right audience, and compare CTR with the target for its funnel stage.
What does a good CTR with a low conversion rate mean?
The ad works, because people click. The problem is after the click. Check the message match between ad and landing page, page speed on mobile, the offer, trust signals, the form or checkout, and the conversion event.
How do I find the cause of a high CPA?
CPA equals CPC divided by the conversion rate. Trace the journey from ad click to landing page to conversion. Compare each step with the previous four weeks, and fix the step with the largest change first.
What is the difference between creative fatigue and audience saturation?
With creative fatigue, one ad gets old and its CTR falls, while newer ads still perform. With audience saturation, the audience is too small for the budget. Frequency rises for all ads and reach stops growing.
What should I check when ad performance drops suddenly?
Check tracking, recent edits, budget changes, account issues such as failed payments or rejected ads, platform outages and site issues. Do these checks before you rebuild the campaign.
Can AI agents diagnose ad performance?
Agents can run the checks every day. They can check tracking, read the change log, compare metrics with a baseline and split CPA into steps. The marketer decides on the offer, price, landing page and budget, and approves new ads.